

Overview
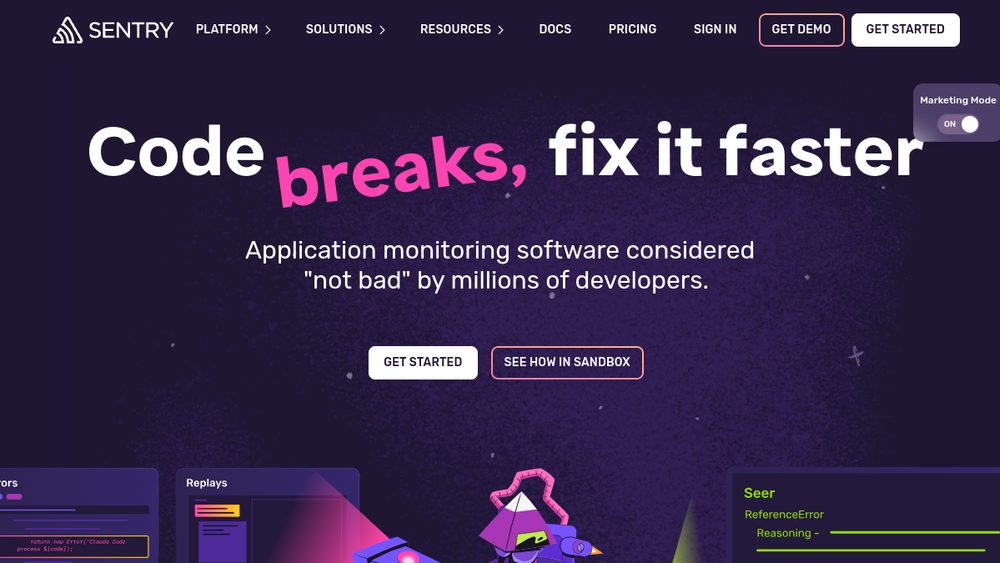
Sentry is an application performance monitoring and error tracking platform designed for developers and software teams. It provides real-time visibility into errors, performance bottlenecks, and user impact, enabling teams to quickly identify and resolve issues before they affect end users. Sentry integrates with a wide range of frameworks and languages, making it a versatile tool for modern development workflows.
Sentry fits into the development lifecycle by offering a centralized hub for monitoring application health. It captures errors, traces, and performance data, then correlates them with releases, code commits, and user sessions. This helps teams move from detecting issues to understanding their root cause and implementing fixes efficiently.
Best for
- Development teams that need to monitor application errors and performance across multiple services and languages.
- DevOps and SRE teams looking to reduce mean time to resolution (MTTR) by correlating incidents with code changes and releases.
- Organizations adopting AI-assisted debugging to accelerate root cause analysis and code fixes.
- Teams that value a developer-first approach with minimal setup and seamless integration into existing workflows.
Key capabilities
- Error tracking: Automatically captures exceptions and errors with full stack traces, context, and user impact.
- Performance monitoring: Traces slow requests, database queries, and N+1 problems to identify bottlenecks.
- AI debugging agent (Seer): Uses context like logs, commits, and traces to explain failures and generate merge-ready patches.
- Release and PR correlation: Maps incidents to specific releases, pull requests, and code owners automatically.
- Wide SDK support: Provides SDKs for popular languages and frameworks including JavaScript, Python, Ruby, Go, Java, .NET, and mobile platforms.
- Integrations: Connects with GitHub, Slack, Jira, Linear, and coding agents via MCP server for streamlined workflows.
Common workflows
-
Monitor production errors: After deploying a new release, a developer monitors Sentry for new errors. They see a stack trace, affected users, and the exact commit that introduced the bug, then fix it and deploy a patch.
-
Trace slow API requests: A backend engineer uses Sentry's tracing to identify a slow endpoint. They drill into the trace to find a database query causing the delay, optimize it, and verify the improvement.
-
Debug frontend issues: A frontend developer receives a report of a failed fetch() in the browser. They use Sentry's session replay to see the user's actions and reproduce the issue, then fix the code.
-
Prevent regressions with AI code review: Before merging a pull request, a developer uses Sentry's AI code review to check if the changes could introduce errors or performance issues based on historical data.
-
Collaborate on incidents: When a critical issue occurs, the team creates a Sentry issue, links it to a Jira ticket, and assigns it to the code owner. They discuss the fix in Slack with context from Sentry.
What to evaluate
- Supported languages and frameworks: Ensure Sentry has SDKs for your tech stack, including mobile and backend languages.
- Deployment options: Consider whether you need cloud-hosted or self-hosted Sentry, and how that fits your infrastructure and compliance requirements.
- Integration with existing tools: Check if Sentry integrates with your version control, issue tracking, and communication platforms.
- Pricing model: Understand how pricing scales with event volume, team size, and advanced features like AI debugging.
- Data privacy and security: Evaluate how Sentry handles sensitive data, including PII, and whether it meets your security standards.
Getting started
- Sign up for a Sentry account at sentry.io and create a new project for your application.
- Install the SDK for your language or framework using the provided command (e.g.,
npx @sentry/wizard@latest -i nextjs). - Configure the SDK with your DSN and set up tracing and sampling rates as needed, then deploy your app to start collecting data.
Why ToolSift lists it
Sentry is categorized under Development, with tags Developer Tools, Monitoring, Error Tracking, and DevOps. It is a leading solution for application monitoring and error tracking, widely adopted by developers. The official URL (https://sentry.io/welcome) was verified, and the page confirms its focus on performance monitoring and error tracking. For more information, visit Sentry.
